
Support every manager
Extend coaching beyond executives and high performers to drive learning for all managers–at a fraction of the cost–with AI-powered coaching.


Drive a growth culture
Nurture an environment of safe and continuous support to close skill gaps and amplify strengths.


Boost business outcomes
Accelerate performance outcomes like innovation and profitability by reinforcing the leadership best practices that encourage engagement, well-being, psychological safety, and manager trust.


Focus on what matters most
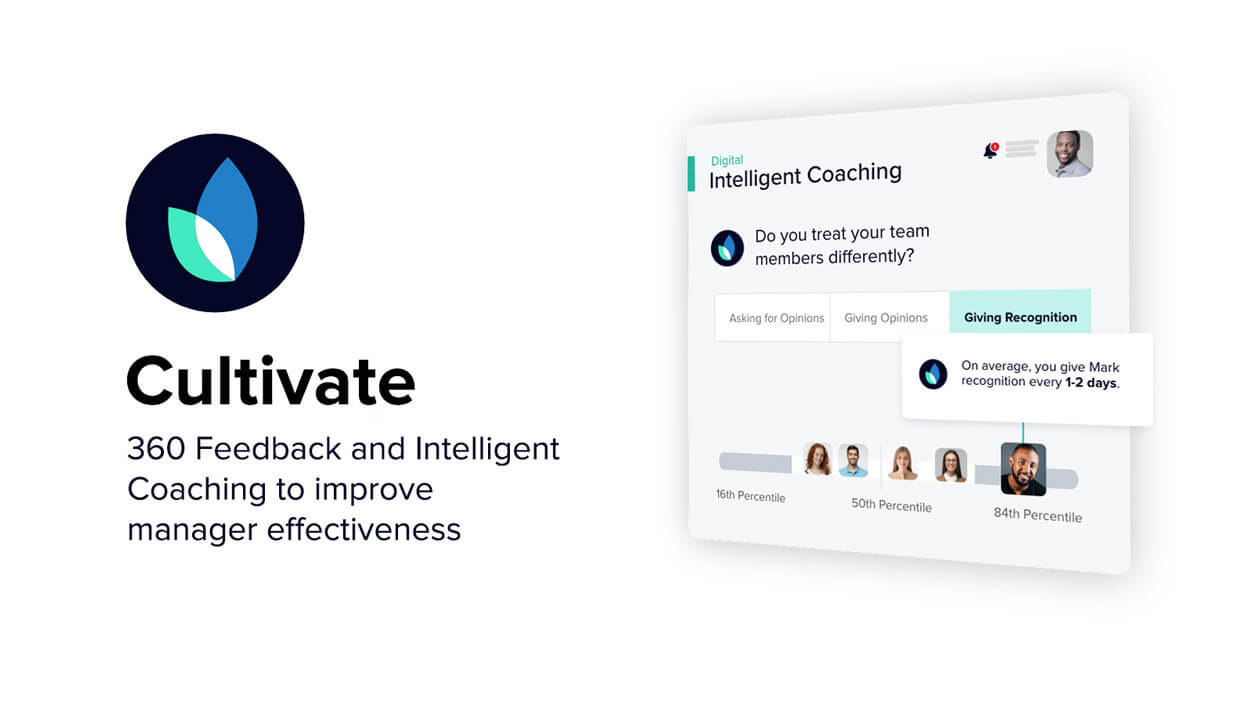
Equip leaders with essential insights into their strengths and areas for development, derived from self-evaluation and input from peers and colleagues they collaborate with.


Best Practices
Learn more about Leadership Development

Coaching at Scale: AI Democratizes Leadership Development
What AI-based coaching is, how it augments human-coaching, and why it’s critical for driving overall organizational health
Read more about Coaching at Scale: AI Democratizes Leadership Development
The Leader’s Guide to AI-enabled Coaching
Examples of AI-based coaching, the nature of digital behaviors, and the impact across organizations with regard to improved relationships, well-being, and leadership
Read more about The Leader’s Guide to AI-enabled Coaching
360 Degree Surveys: The Most Important Things To Know
The advantages of 360 degree surveys, the most effective design for surveys, and the most effective ways to use the data generated by 360 degree feedback surveys
Read more about 360 Degree Surveys: The Most Important Things To Know